- Game Lab
- Drawing Shapes
- Shapes and Parameters
- Sprites
- The Counter Pattern
- Velocity and the Counter Pattern
- The Draw Loop
- Debugging with Watchers
- Animation Tab
- App Lab
- Responding to User Input
- Taking Input with getProperty
- Multi-Screen Apps
- Changing Screens
- Designing Screens with Code
- The Counter Pattern
- Design Mode
- If Statements
- App Lab Table Data Storage
- Maker Toolkit
- Circuit Playground
- Color Lights
- Playing Notes
- Analog Sensors
- Changing Sensor Scale
- Physical Input
- Producing Output
- Circuits and Buttons
- Circuits and LEDs
- The Accelerometer
- Accelerometer Events
- Board Events
- Data and Change Events
- JavaScript
- Booleans and Comparison Operators
- If Statements
- If-Else Statements
- For Loops
- Timed Loop
- Timed For Loop
- Variables
- Naming Variables
- Arrays
- Modifying Arrays
- Random Numbers
- Functions
- Patterns
- HTML
- CSS
- Patterns
- Counter Patterns with Event
- Variable with String Concatenation Pattern
- The updateScreen() Pattern
- Checking Multiple Conditions with If-Else-If
- Random List Access Pattern
- List Scrolling Pattern
- When to Make a Function
- Debugging Variable Scope: Functions
- List Filter Pattern
- List Reduce Pattern
- Other
- AI Lab
Concepts
Selecting a Label
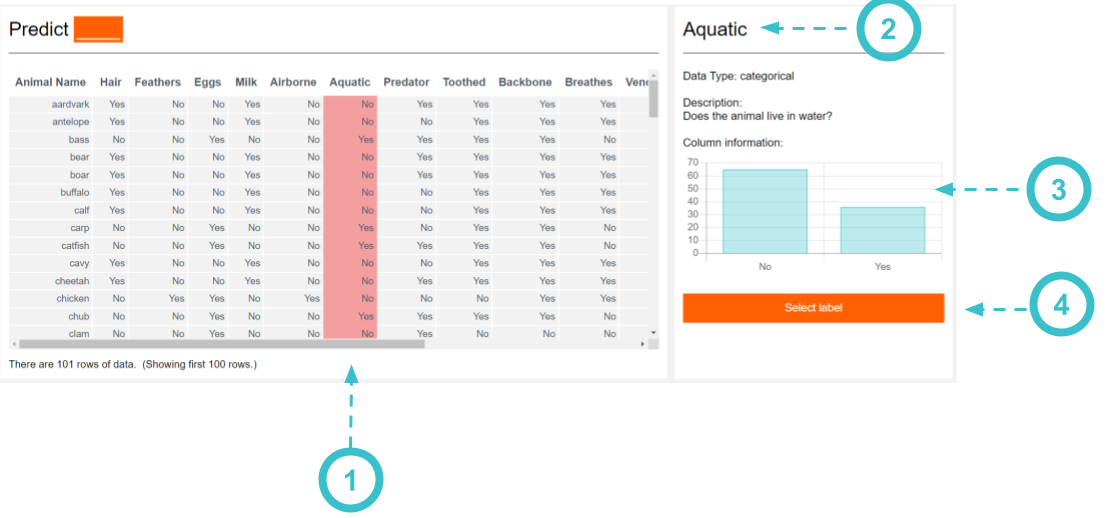
- Click on a column to view more information about it
- This is a description of the column you selected. It can tell you more information about the data in this column. If the data came from a survey, this will usually contain the question that was asked on the survey
- A Bar chart shows how many times a certain value appears in the chart. For labels, its important to have a balanced representation of your data. If certain values are overrepresented or underrepresented, this can lead to a biased machine learning model.
- Press the "Add label" button to use this column as the output of your machine learning model. This is what AI Bot will try to predict.
Video
(Opens YouTube in new tab)

Found a bug in the documentation? Let us know at documentation@code.org