Using Data with Numerical Features
Looking at Numerical Data
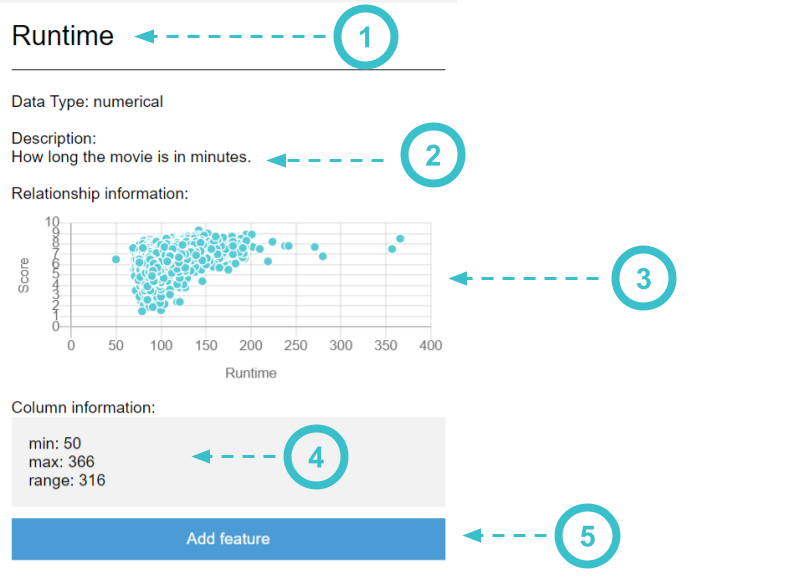
When you click on a column with numerical data, you can view more information in the panel on the right-side of AI Lab
- This is the name of the column that you selected
- This is a description of the column you selected. It can tell you more information about the data in this column. If the data came from a survey, this will usually contain the question that was asked on the survey
- A Scatter Plot shows how this column is related to the label you are trying to predict.
- A Range chart shows the minimum and maximum values in this column, and the range between them. This can be helpful in identifying if there is a mistake in your data, such as a value accidentally being too large or too small.
- Press the "Add feature" button to use this column as one of the inputs in your machine learning model
Reading Scatter Plots
In the Scatter Plot, look to see if the feature you picked has a strong relationship with your label. You can see if the points follow a pattern that will let you make a "When the feature is... that means the label is..." statement. For example: - When the temperature is lower, the number of bats in the sky is higher - When the cost of tickets is higher, the attendance to the games is lower
These types of patterns make it easier for AI Bot to make predictions.
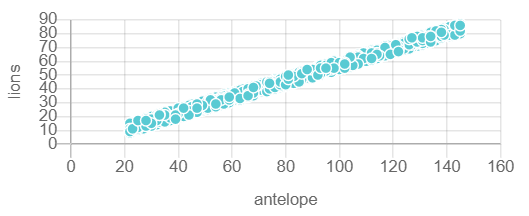
This chart shows a strong relationship between the feature on the bottom of the graph and the label on the side of the graph. - When there are a low number of antelopes, there are also a low number of lions - When there are a high number of antelopes, there are also a high number of lions.
This means if AI Bot knows how many antelopes are in the wild, it has a strong change of predicting how many lions are also in the wild.
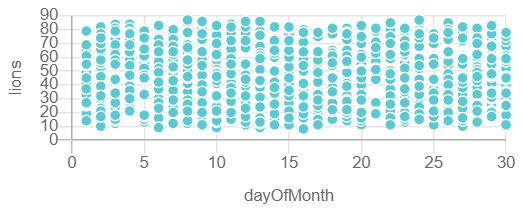
This chart does not show a strong relationship between the feature and the label. When looking at what day of the month it is, there is a wide range in the number of lions you could see on that particular day. A better graph would have all of the points clustered closer together for a particular day of the month.
This means if AI Bot knows what day of the month it is, that doesn't help narrow down how many lions may have been in the wild on that day.
Video
(Opens YouTube in new tab)
Found a bug in the documentation? Let us know at documentation@code.org